Find the real problem, build the permanent fix
Shipping systems for quoting, logistics ops, and B2B pricing
How I work
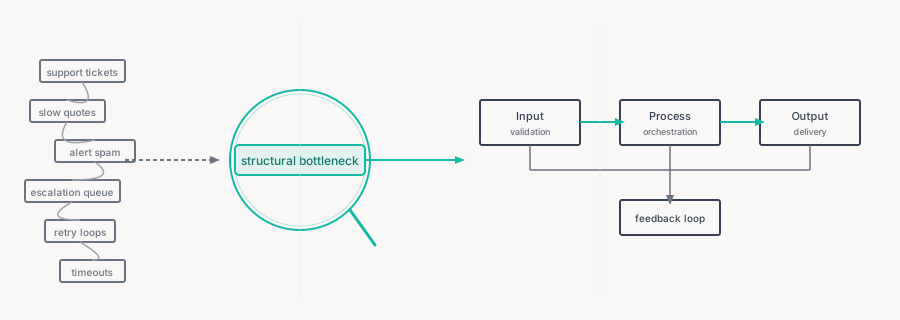
I identify structural bottlenecks behind operational chaos and build systems that make fixes permanent. This pattern repeats across every domain I've worked in:
- Diagnostic Reframing: I identify the structural bottleneck behind surface problems. "Slow quoting" was actually trust erosion. "Low accuracy" was alert fatigue. "Pricing confusion" was decision architecture requiring advisor intervention.
- Production System Building: I ship AI and automation systems that eliminate ambiguity. Built CV pipelines + OR engines (20× faster quoting). Built scenario-first energy modeling (Project Epsilon). Built pricing engines (3× take rate).
- Commercial Outcome Measurement: I tie every system to business metrics. 20× faster quoting → 93% fill rate. 85% false-positive reduction → contract renewal. 3× take rate → churn elimination.
Engagements: Product Lead, Technical Product Owner, and AI Product Manager roles where diagnostic thinking + system building + outcome measurement are the job. Ideal for ops-AI companies, system-heavy startups, and roles that bridge technical complexity with commercial clarity.
Capabilities
Selected Work
Four themes run through this work: quoting systems (CV + OR for logistics ops), ops & energy modeling (scenario-first deployability), B2B pricing architecture (tier consolidation, take rate, ARPU), and product-led growth (activation, lifecycle, unit economics). Expandable case summaries below; separate deep-dive pages cover eval harnesses, pricing ladders, PLG, and product notes.
20× Faster Quoting: Computer Vision + Operations Research
Operations Research
VLM / computer vision
SMS / voice agents
Pricing Architecture
Heap
Segment
20× Faster Quoting: Computer Vision + Operations Research
Challenge
Manual job quoting took dispatchers 1 hour per estimate. Quotes were unreliable, causing margin erosion from inaccurate pricing and losing customers to faster competitors.
Commercial impact: Checkout abandonment was high, and operational costs scaled linearly with volume, hurting cash flows and unit economics.
Market Context
Last-mile moving and delivery was still quote-by-phone. Customers called 3-5 movers and booked whoever called back first with a price: speed-to-quote was the primary booking driver, not price. Digital-first competitors (TaskRabbit-style platforms) were taking share not because they were cheaper but because they were instant. The opportunity was to out-quote, not out-price.
Discovery
Focus groups with bookers surfaced that the dispatcher call was a trust barrier, as customers felt sized up and upsold before any price anchor. Session replay (Heap, Clarity) showed 60%+ checkout abandonment at the manual item-entry step; customers were typing dimensions they didn’t know and giving up. Tree tests confirmed customers expected a price in under 2 minutes (Uber/DoorDash mental model). Opportunity maps ranked quote-flow simplification as the highest-leverage fix over booking confirmation and crew communication.
Decision & Cuts
CV approach chosen over a structured form, as simplifying the form wasn’t enough since dimension-entry was the primary abandonment driver. OR engine chosen over lookup-table pricing, since multi-item, multi-floor jobs had 40%+ margin error with static tables, causing the very dispatcher call the product was meant to eliminate.
V1 explicitly cut: real-time dispatcher chat overlay, customer subscription model, and automated route optimization (all deferred to preserve quote-flow focus).
What Was Built
- Computer Vision: Customers photograph items; CV model estimates volume, weight class, and handling complexity (no dispatcher call required).
- Operations Research engine: Solves three NP-hard sub-problems simultaneously (job duration, optimal crew size, 3D bin packing for truck loading), reducing costing latency by 95% and increasing volume predictive accuracy to 85%.
- SMS/Voice AI agent: Automated intake, booking confirmations, and reschedules, deflecting 50% of support tickets with zero human intervention.
- Real-time pricing & payment flows (Stripe, Square) based on distance and volume, eliminating the checkout bottleneck.
Technical Stack
R (Bayesian modeling), SQL, Computer Vision algorithms, Conversational AI frameworks, SMS API integration, Historical job data analysis, Predictive modeling, Operations research optimization
My Role
Founding PM reporting directly to CEO. Owned user research, product strategy, conversion, and retention. Led a team of 4 developers (1 direct report). Defined the OR engine architecture, drove research-to-roadmap decisions, and set the commercialization strategy that turned an internal tool into Quotely SaaS.
Results
- Margin protection: 85% of jobs finish within quoted time window, protecting profitability.
- Cash flow acceleration: Real-time pricing reduced quote-to-payment drop-off.
- Unit economics: ~$100 CAC with $1,000+ LTV and 12+ month retention.
- Commercialization: $500k+ GMV platform now sold as Quotely, a standalone SaaS.
Post-Launch
Segment instrumentation showed 70%+ of bookings came from returning customers, which shifted roadmap priority to lifecycle messaging and retention over new-user acquisition. Fill rate data revealed weekend supply bottlenecks, adding crew availability forecasting to the roadmap. The OR engine’s accuracy drew unplanned inbound interest from other logistics operators, and that signal drove the decision to commercialize it as Quotely rather than keep it proprietary.
Key Insight
AI systems succeed when they reduce operational ambiguity, not when they maximize sophistication. Structured information capture and reliable handoffs beat open-ended interaction. The OR engine’s commercial value was unplanned, emerging from measuring fill rate rather than from a product roadmap.
Eval deep-dive
I designed a four-layer eval architecture for Quotely: vision, catalog matching, logistics snapshots, and end-to-end quote accuracy, with offline/online flywheels and CI gates. Quotely evals →
Separately, I designed eval metrics for conversational agents: when Cohen’s κ applies, HITL recall/precision, and fixture task-success gates (Moovez SMS agent). Agent evals →
Scenario-First Energy Modeling: Domain Core + Multi-Engine Adapters
PyPSA (Linear Programming)
Monte Carlo
Operations Research
NPV / IRR / CF Modeling
Scenario-First Energy Modeling: Domain Core + Multi-Engine Adapters
Challenge
Clean-energy planning slows down when sizing, stress-testing, and finance run in disconnected tools: assumptions drift, comparisons break, and nobody can defend a single narrative from deck to data room. During my MBA I built spreadsheet models to reason about deployability; they surfaced the questions but stayed siloed.
Engineering risk: Naively porting workbook logic to a UI yields surface parity without semantic correctness (hidden unit mismatches, unsafe handoffs between sizing and stress, economics that ignore feeder reality).
Solution
Project Epsilon connects those worlds with one version-controlled
Scenario that feeds every engine, eliminating copy-paste drift between models.
- Six-step guided workflow: define scenario → size portfolio → stress-test → evaluate finance → validate network → generate report
- Three production adapters (today): DC-PPA · ISO-RTO · Microgrid, plus network validation (feeder / N-1 / AC power flow) as the physical feasibility layer
- Explicit handoffs: typed
CapacitySeedfrom sizing into stress and finance - Assurance layer: structured audit findings, 100-point confidence scoring with severity-based deductions, SHA-256 scenario-hash staleness, prerequisite gating so stress cannot run on silent stale inputs
- BOM bridge: sizing flows emit starter equipment catalog rows (procurement-grade narrative from modeled MW/MWh)
- Reporting: compare runs, field-by-field assumption diffs, Markdown/HTML export
Positioning: Planning and diligence for data centers, microgrids, and RTO-style stress, rather than a real-time EMS.
Technical Stack
Python: custom PyPSA linear programs for 24/7 CFE and microgrid
sizing; ISO-RTO Monte Carlo stress testing; agent-based VPP dispatch;
AC power flow / distribution validation. Typed Scenario contract,
EngineRegistry, ScenarioStore, normalized finance assumptions (e.g. WACC,
battery efficiency) for cross-engine comparability.
Delivery: Public app hosted on Cloudflare Workers (epsilon.xblavania.workers.dev).
My Role
Product builder and engineer: learned distributed-energy dynamics deeply enough to shape module boundaries (what must be true for sizing, stress, finance, and network to tell one coherent story). Implemented custom PyPSA LPs, ABM-style VPP dispatch, Monte Carlo stress paths, and end-to-end architecture that bridges physical network validation with financial planning. Owned scenario contract, adapter patterns, and assurance story, rather than just a spreadsheet port.
Results
- Single scenario state across engines; field-by-field diffs and run comparison
- Structured audit + confidence and stale-run detection tied to scenario hashes
- At a glance: 6 workflow steps · 3 production adapters · 100-point confidence model · 11 starter BOM SKUs
Outputs are for analysis and professional judgment only; they do not constitute legal, regulatory, or FERC filing advice.
Key Insight
Each workflow step surfaces a risk class the others cannot see. Siloed software breaks narrative coherence between pitch physics and finance; deployability is a coupling problem. The product’s job is to make those couplings explicit, comparable, and reviewable, not to maximize chart polish.
Pricing Architecture: 9-Year Loss-Leader Ladder Without a Price Book
Pricing Architecture
ARPU optimization
Pricing Architecture: 9-Year Loss-Leader Ladder Without a Price Book
Commercial Problem
Heterogeneous buyers (advisors, brokers, appraisers) with different jobs and ACV tolerance — and no public price book. Every customer got a composed deal (module mix × seats × term × negotiated discount). The wrong move would have been discounting BVX to win deals NTV should land.
Architecture
NTV (also branded Capitalization 2.0 / AltBV) was a deliberate loss-leader into an adjacent terminal-value market. BVX was the margin target SKU. Upgrade was driven by in-product feature fences — spreadsheet capitalization vs full deal equilibrium — not BVX discounting. Custom deals let NTV carry the deepest discount without training discount expectation on BVX.
Telemetry
In-house analytics showed fewer than 20% weekly active users despite strong demo feedback — the value metric was client-ready presentation speed, not model depth. Killed fee-benchmarking and deal-database bets; pivoted products 3–5 to presentation/export; evolved custom deal templates from usage-pattern analysis over nine years.
Results
- 14% retention lift from onboarding depth & lifecycle messaging
- 7% conversion lift from repositioning to “Excel → client presentation”
- Multi-product adopters (3+) retained at 2× single-product rate
Key Insight
Revenue expanded when packaging matched the value metric. Presentation modules and feature fences drove voluntary ARPU growth — a pricing architecture outcome, not a list-price hike. Loss-leader economics only work when you instrument conversion, expansion, and blended margin.
3× Take Rate Improvement: Pricing Architecture Redesign
STP
Tier consolidation
Pricing strategy
3× Take Rate Improvement: Pricing Architecture Redesign
Market Context
M&A financing for sub-$10M deals is an underserved niche: traditional lenders don’t understand the deal structure, and most platforms used opaque, advisor-mediated pricing requiring a sales call to get a number. VWLL’s digital-first approach was the differentiator, but the pricing UX was recreating the friction it was meant to eliminate.
Discovery
Opportunity maps surfaced that churn was concentrated at the plan-selection step, meaning users were dropping before they ever experienced the product. STP analysis revealed all three real customer segments were being served by the same two plans, making the other two tiers noise rather than value. Focus groups with M&A advisors confirmed they were pre-qualifying which clients to even recommend the platform to because they didn’t trust clients to pick the right plan without a guidance call, effectively gatekeeping the funnel. Tree tests showed users couldn’t distinguish plan value in under 30 seconds.
Decision & Cuts
Consolidated from 4 tiers to 3 by eliminating the two lowest-adoption plans. The decision was structural, not cosmetic, since better labels or tooltips would not fix a plan architecture that required advisor intervention to navigate. Launching with fewer tiers meant losing upsell optionality short-term, a deliberate tradeoff validated by the research.
Solution
- Consolidated from 4 pricing tiers to 3 by eliminating lowest-adoption plans
- STP and segmentation analysis informed structural consolidation validated with focus groups and tree tests before launch
- Repositioned plans around clearer value propositions with defined migration strategy for existing customers
Results
- Primary driver was advisor behavior change: advisors stopped pre-filtering clients and started recommending the platform more broadly once plan selection stopped being a barrier
- Churn from plan indecision dropped to near zero, confirming the structural diagnosis
Key Insight
Pricing problems are often decision architecture problems, not just monetization problems. Simplifying choices can be more valuable than optimizing price points, and advisor behavior change, not customer behavior change, was the real unlock.
85% False Alert Reduction: Student Safety Detection System
85% False Alert Reduction: Student Safety Detection System
Market Context
K-12 content filtering and student safety monitoring is a trust-sensitive, compliance-driven market. Districts purchase under regulatory pressure, but adoption depends entirely on whether staff act on alerts. The competitive dynamic is not feature-depth, but rather whether the system generates a signal that counselors and IT admins are willing to act on. Alert fatigue had already collapsed trust at similar products district-wide; Netsweeper was at risk of the same outcome.
Discovery
Focus groups with district IT admins and school counselors revealed the core behavioral problem: staff had stopped opening the alert dashboard entirely, because 8 out of 10 alerts had been false positives long enough that checking them felt like wasted time. The research surfaced a competing hypothesis from the engineering team: add new detection categories (more coverage = more value). The research showed the opposite: more detection with the same false-positive rate would accelerate trust collapse. Tree tests showed counselors couldn’t locate high-severity alerts, which were visually buried under low-severity noise.
Decision & Cuts
Reframed the product’s core success metric from “detection accuracy” to “operational trust”, a shift that unlocked the correct prioritization framework and resolved the roadmap standoff with engineering. Deprioritized all new feature development for a full quarter. Redirected the outsourced team entirely to false-positive pruning, alert workflow redesign, and structured QA cycles.
Explicitly rejected: the proposal to add new detection model categories until existing signal quality was restored.
Solution
- Prioritized signal quality over feature expansion for a full quarter
- Managed outsourced engineering team through iterative false-positive pruning and structured QA cycles
- Redesigned alert workflow: surfaced high-severity alerts, buried low-severity noise
- Redesigned edge-case handling that had caused the highest-volume incorrect alerts
Results
- IT admins re-engaged with the dashboard unprompted, which was the behavioral signal that trust had been restored
- Client relationship stabilized and contract renewed
- Restored trust reopened feature expansion conversations that had previously been dismissed by disengaged staff
Key Insight
Detection systems fail when users stop trusting the signal. Accuracy metrics alone are insufficient. Operational reliability matters more than theoretical performance, and the right metric unlocked the correct prioritization framework over a roadmap standoff with engineering.
Deep dives
BVXpress pricing architecture
Loss-leader ladder, feature fences, and custom deal templates across a nine-year SaaS portfolio without a public price book.
Product-led growth
Owned CAC, ARPU, TTV, retention, and churn at BVXpress and Moovez: in-product loops, lifecycle, and mix-model CAC honesty.
Quotely eval architecture
Four-layer eval system for vision, catalog matching, logistics snapshots, and end-to-end quote accuracy with CI gates.
Conversational agent evals
When Cohen’s κ applies, HITL recall/precision, and fixture task-success gates for SMS support agents.
HRIS for M&A
BVXpress product for ICI clients: workforce ingestion, diligence reporting, and transaction compliance workflows.
Dual-sided telehealth platform
Patient and clinician experiences designed for white-label deployment to a regional government health system.
Cybersecurity marketplace
Search-first discovery for physical appliances, virtual appliances, and service add-ons with Mixpanel + Pendo instrumentation.
Career Arc
Values & Principles
- Build for operational simplicity first, add features only when they solve real problems → Cut dispatcher chat overlay, subscription model, and route optimization from Moovez V1 to protect quote-flow focus.
- Fix decision-making upstream before building dashboards downstream → Froze Netsweeper feature development for a full quarter; rebuilt alert signal quality before adding any new detection categories.
- Prioritize signal quality over data volume → Moovez: Segment instrumentation on fill rate and returning-customer bookings shifted roadmap from acquisition to lifecycle retention (better signal, not more data).
- Positive feedback in demos masks workflow non-adoption: measure active use, not satisfaction → BVXpress: <20% weekly active users despite strong demo feedback. Pivoted roadmap after telemetry revealed the real friction point.
- Reframe the metric before you reframe the roadmap → Shifting Netsweeper from “detection accuracy” to “operational trust” resolved a roadmap standoff with engineering without adding a single feature.